
Nextbike.lol
Nextbike is the biggest bike-sharing service in Europe. It’s available in hundreds of cities across the continent and is mostly used for short-term rentals. I personally use it pretty much every week to get around the city. Especially at night when public transport is limited, Nextbike has been a lifesaver many times.
The Nextbike app isn’t anything special, but it does the job. It shows you all the bikes and stations in your location and lets you rent a bike by scanning a QR code. Naturally, after using the app for the thousandth time, I got curious and wanted to know how it works under the hood.
This led to a journey of reverse engineering the Nextbike app and building the first visualization of the data.
Reverse Engineering
I wrote a separate blog post about the process of reverse engineering the Nextbike app and building the first visualization of the data.
TL;DR: It was a lot of fun, but it turned out to be unnecessary, as the endpoints I found were already public and didn’t require any authentication. I don’t regret doing it at all, though!
Data Wrangling
Once I knew all the endpoints and how to use them, I could start collecting the data. For this, I had to think of a way to store the data efficiently and make it easy to query later on.
I decided to use a PostgreSQL database with the PostGIS extension, which makes it easy to store and query geospatial data. For the Nextbike map data, I came up with the following tables:
networks: Stores all the top level networks that Nextbike operates in. (calledcountriesin the API but they aren’t always countries)areas: Stores all the areas that Nextbike operates in. (calledcitiesin the API but they aren’t always cities)stations: Stores all the stations that Nextbike operates.bikes: Stores general information about the bikes.bike_positions: Stores each seen position for all bikes. Whenever a bike moves a significant distance we store a new position.bike_movements: A materialized view that calculates the movement history for all bikes from thebike_positionstable.
The materialized view isn’t strictly necessary, but it makes it much easier and faster to query the data.
Challenges
-
The data returned by the API isn’t really public, so it always takes a bit of guessing and trial and error to understand how things relate to each other. For example, I had to learn the hard way that bike numbers aren’t globally unique; they are only unique within a single network. This caused some really weird behavior in the dataset where it looked like bikes jumped between networks until I figured it out.
-
Bike positions aren’t always accurate and frequently jump around. This is probably because the GPS data is not always reliable. To prevent storing a new data point whenever a bike moves a few meters, I added a minimum distance threshold of 250 meters. When a bike moves less than 250 meters we ignore the movement entirely.
-
Besides GPS inaccuracies, there are cases where bikes just disappear and then reappear tens of kilometers away from their last known location in a matter of minutes. I’m not sure why this happens, but to prevent these jumps from messing up the dataset, I added a sanity check to exclude movements faster than 40 km/h.
Visualization
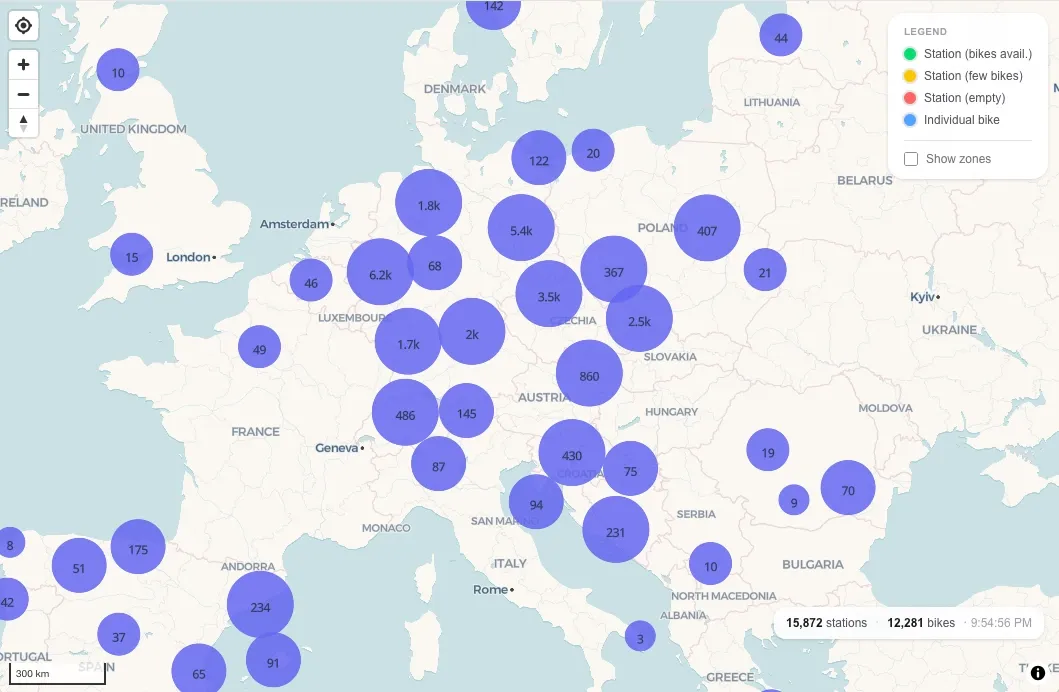
My initial goal was just to have a map where I could see the current location of all the bikes and how they moved around the city. For this, I used the React Map GL library and the open-source fork of Mapbox called MapLibre. Together, these libraries make it easy to render a map and add custom layers without having to pay for an API key.
")
The different types of stations and bikes are rendered in different colors. Clicking on a bike or station shows more information about it and, for bikes, a trail of positions over time.
")
Later, I also added a layer to visualize the different zones for each city. They consist of many polygons that dictate where bikes can be parked and where users have to pay for parking. PostGIS was the perfect tool for this, as it makes it easy to query intersections between a point and a polygon.
")
End Result
May I present to you nextbike.lol, the best source for Nextbike statistics and insights!
You can see the current location of all Nextbike bikes on the map below. For bikes that are parked at a station, you can see the station name and the number of bikes available. For free-floating bikes, you can see the last known location and even view the bike’s movement history.
Outside of the map, you can see statistics, leaderboards, and lists of networks, areas, stations, and bikes. Ever wondered which bikes are the most productive and which ones are neglected by everyone?
This project is still ongoing, and I have a lot of ideas for future improvements, new features, and things to do with the data. For now, I’ll let it run and collect more data so I can build even more interesting visualizations in the future.